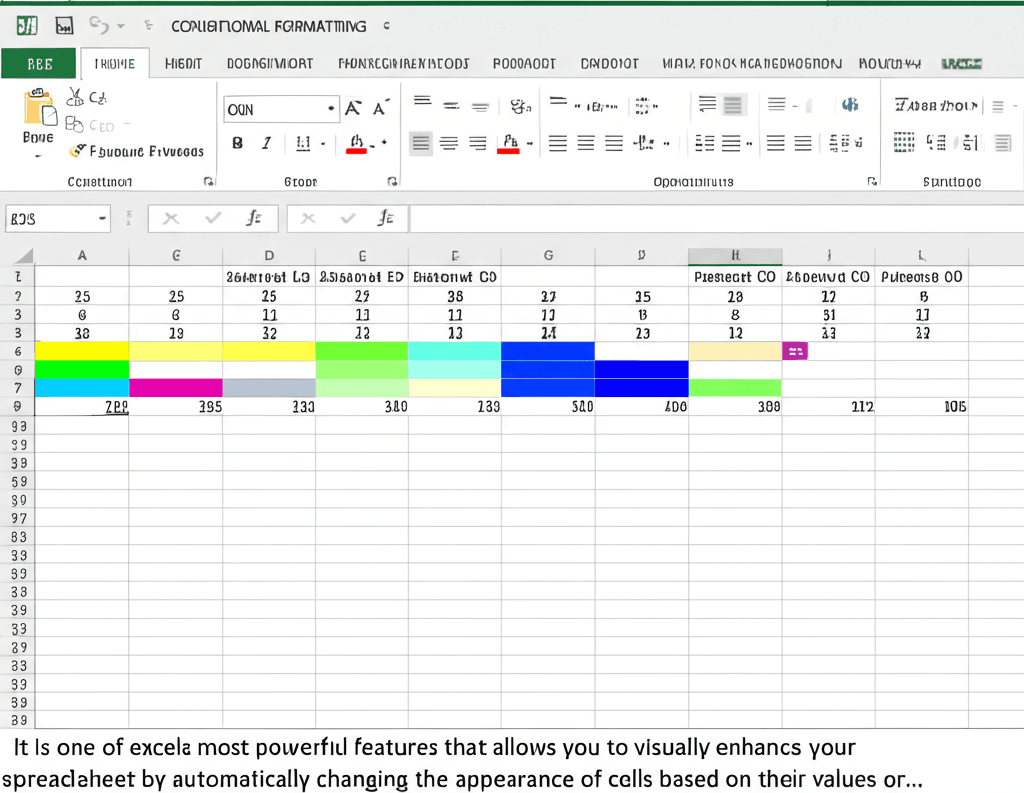
Conditional formatting in Microsoft Excel is a powerful feature designed to enhance data visualization and analysis by automatically applying formatting changes to cells based on specific criteria. This dynamic tool transforms raw data into easily interpretable visuals, making it an indispensable asset for professionals dealing with complex datasets.
### What Is Conditional Formatting?
At its essence, conditional formatting allows users to define rules that alter the appearance of cells—such as changing colors, adding data bars, or inserting icons—when certain conditions are met. For example, if a sales figure falls below a set target, the cell could turn red to indicate underperformance; conversely, exceeding targets might highlight the cell in green. This immediate visual feedback saves time and reduces the need for manual highlighting, turning data exploration more efficient and intuitive.
### Key Benefits for Data Analysis
Conditional formatting significantly elevates data analysis by providing instant insights and improving clarity. Some primary advantages include:
– **Flagging Underperformance**: It enables quick identification of issues, such as low sales numbers or budget deficits, by visually emphasizing problematic data points. This proactive approach helps in addressing challenges early, reducing potential risks.
– **Highlighting Outstanding Results**: By drawing attention to top performers or successes, it aids in recognizing achievements. For instance, in a project management spreadsheet, marking milestones ahead of schedule with a green flag can boost morale and provide clear benchmarks for others.
– **Creating Interactive Dashboards**: It simplifies the construction of dynamic dashboards that update automatically. Users can build self-contained reports with color-coded metrics, making complex data accessible to non-technical audiences and supporting better decision-making across teams.
– **Improving Data Storytelling**: The visual elements created through conditional formatting help narrate data stories effectively, transforming numbers into compelling insights that drive action.
### How to Implement Conditional Formatting
Applying conditional formatting is straightforward and can be done in Excel with a few clicks:
1. **Select Your Data**: Highlight the range of cells or the entire dataset you wish to format.
2. **Navigate to Conditional Formatting**: Go to the ‘Home’ tab on the Excel ribbon and click on ‘Conditional Formatting’. From here, choose options like ‘Highlight Cells Rules’ for quick scenarios or ‘New Rule’ for custom conditions.
3. **Define Conditions and Formatting**: Set criteria such as comparing values (e.g., greater than, less than, top 10%), text matches, or date comparisons. Then, select formatting styles like background colors, data bars, or icon sets to visually represent the rules.
4. **Apply and Refine**: After setting your rules, preview the changes and adjust as needed. Excel provides tools to manage multiple rules, ensuring your formatting remains effective without clutter.
### Advanced Techniques for Deeper Analysis
For more sophisticated data analysis, Excel offers advanced conditional formatting features:
– **Color Scales**: Use gradient scales (e.g., from red to green) to show ranges in your data, such as performance levels from poor to excellent.
– **Icon Sets**: Incorporate icons like traffic lights (red, yellow, green) or arrows to indicate trends, making data trends instantly recognizable.
– **Top/Bottom Rules**: Apply rules to highlight the highest or lowest values in a range, such as identifying the top 5% of customers by revenue.
– **Data Bar Charts**: Add mini-chart bars within cells to visualize value comparisons, which is particularly useful for quick overviews.
### Why It Matters in Today’s Data-Driven World
In an era where data is abundant but insights are scarce, conditional formatting bridges the gap by making analysis more accessible and insightful. It empowers users to handle large datasets with confidence, reducing errors and improving efficiency. Whether you’re a business analyst, financial professional, or student, mastering this feature can elevate your Excel skills and enhance the quality of your data-driven outputs.
Overall, conditional formatting is not just a tool; it’s a strategy for turning data into actionable intelligence. By incorporating it into your workflow, you can unlock new levels of efficiency and clarity in your data analysis endeavors.

Leave a Reply