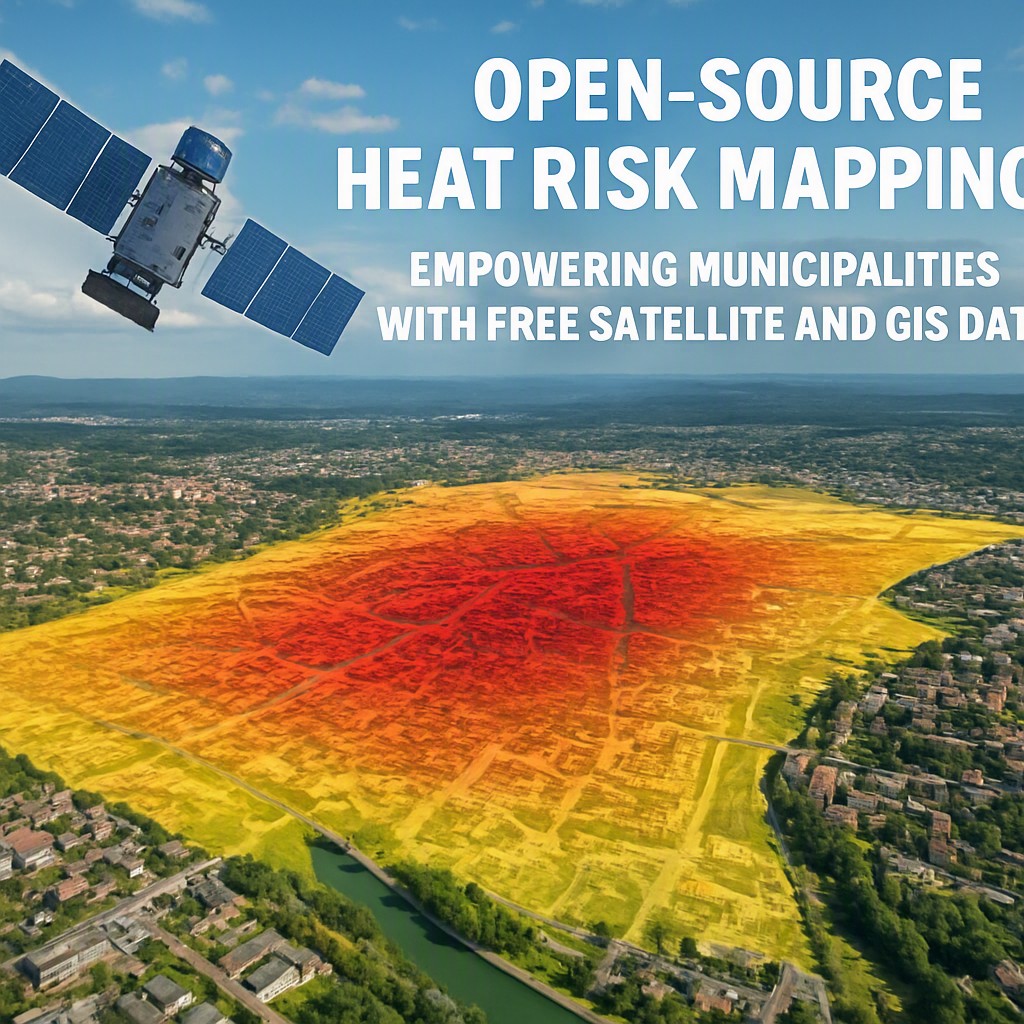
Open-Source Heat Risk Mapping for Municipal Planning
A Python CLI that calculates surface temperature (LST), urban heat island (UHI) intensity, and a thermal vulnerability index (HVI) using only Landsat imagery, OpenStreetMap data, and census information. Designed for local governments without a GIS department.
The Growing Threat of Urban Heat
Extreme heat events have become the deadliest climate‑related hazard in Europe, with the summer of 2023 alone responsible for roughly 60,000 fatalities. Urban heat islands amplify these impacts by raising temperatures in built‑up neighborhoods several degrees above surrounding green areas. Vulnerable groups—older adults, people without air‑conditioning, and low‑income households—suffer the greatest health consequences.
Municipalities need two pieces of information to mitigate risk: where the highest temperatures occur and who is exposed in those locations. Commercial mapping platforms are prohibitively expensive, while academic tools are usually tailored to a single city and require advanced GIS expertise.
The Open‑Source Gap
GitHub searches conducted in August 2026 reveal a stark shortage of free, maintained solutions for small‑to‑medium municipalities. Existing repositories cover isolated components such as Landsat‑derived LST calculations, but none integrate surface temperature, heat island detection, and population vulnerability into a single, user‑friendly workflow.
- Urban heat island vulnerability open source = 0
- Urban heat index small city = 0
- Heat risk mapping open source = 1 (single repository for Philadelphia, no stars)
- NASA UHEAT tool = 24 entries, last updated in 2022
This scarcity limits the ability of town halls to develop evidence‑based heat‑risk strategies.
Introducing heatriskmap
heatriskmap is a local‑first command‑line interface that stitches together proven open‑source components without requiring any machine‑learning models. The workflow follows four core steps:
- LST extraction: Computes land‑surface temperature in °C from Landsat‑8/9 bands B10, B4, and B5 using official USGS calibration constants and the simple window method described by Avdan & Jovanovska (2016).
- UHI detection: Calculates the per‑pixel temperature differential against a rural baseline and flags hotspots that exceed the mean plus two standard deviations.
- HVI calculation: Generates a zone‑level vulnerability index weighted 50 % thermal exposure, 25 % tree‑cover deficit (derived from OpenStreetMap via Overpass), and 25 % census‑based vulnerable population.
- Output formats: Produces GeoTIFF (EPSG:4326) for spatial analysis and a GeoJSON file that aggregates exposed population in temperature bands (≥32 °C, ≥38 °C, ≥42 °C).
How to Deploy
The tool can be installed directly from the source repository:
pip install -e .
heatrisk ingest --b10 B10.tif --b4 B4.tif --b5 B5.tif --census census.csv -w workdir/
Subsequent commands generate the LST map, identify UHI hotspots, and compute the HVI layer. All processing occurs locally, ensuring data sovereignty and compliance with privacy regulations.
Why Open Data Matters
Open‑source geospatial data—satellite imagery, OpenStreetMap features, and publicly released census tables—provide a dynamic, transparent foundation for climate‑resilient planning. As highlighted by datos.gob.es, integrating diverse open datasets enables municipalities to build robust thermal models, pinpoint critical zones, and evaluate mitigation measures such as tree‑planting campaigns or reflective pavement projects.
Benefits for Municipal Decision‑Makers
- Cost‑effective: No licensing fees; runs on standard Python environments.
- Scalable: Applicable to any municipality regardless of size or existing GIS capacity.
- Actionable insights: Delivers clear temperature thresholds linked to exposed population counts, facilitating targeted outreach and resource allocation.
- Reproducible: All steps are scripted, allowing annual updates as new Landsat scenes become available.
Future Directions
Planned enhancements include integration with real‑time weather APIs, automated generation of printable heat‑risk PDFs for public communication, and a web‑based viewer that overlays UHI maps with municipal zoning layers. Community contributions are encouraged through the project’s public GitHub repository.
By democratizing access to high‑resolution thermal data,
heatriskmapempowers local authorities to protect vulnerable residents and build climate‑resilient cities without the overhead of proprietary GIS solutions.
Leave a Reply